
Fig. 3.
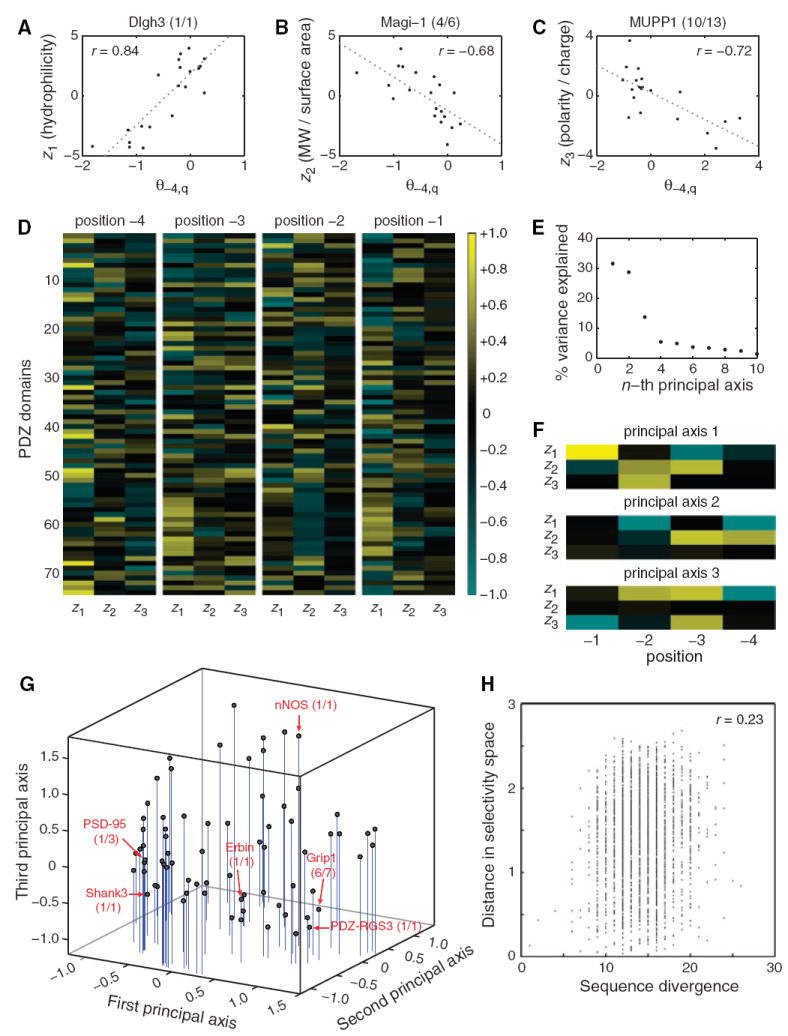
(A to C) Correlations between z scales and model parameters at position −4 for three PDZ domains. (A) z1 positively correlates with θ−4,q for Dlgh3 (1/1). (B) z2 negatively correlates with θ−4,q for Magi-1 (4/6). (C) z3 negatively correlates with θ−4,q for MUPP1 (10/13). (D) Correlation matrix between the model parameters for all 74 PDZ domains at positions −4, −3, −2, and −1 and the first three z scales of the amino acids. (E) Percentage of variance in the correlation matrix that is explained by the 12 principal axes identified through singular-value decomposition. (F) Graphical representation of the first three principal axes, used to define PDZ domain selectivity space. (G) Distribution of the 74 PDZ domains in selectivity space. Selected PDZ domains are shown, representing class I domains [PSD-95 (1/3) and Shank3 (1/1)], class II domains [Grip1 (6/7) and PDZ-RGS3 (1/1)], and class III domains [nNOS (1/1)]. Erbin (1/1), which has been described as a dual-specificity domain, lies between the class I and class II domains. (H) Correlation between pairwise sequence divergence of PDZ domains and their pairwise distances in selectivity space. Sequence divergence was obtained from pairwise alignments performed with Vector NTI version 8 (InforMax, Invitrogen Life Science Software, Frederick, Maryland), using the blosum62mt2 matrix. Pairwise distances in selectivity space are Euclidean distances obtained from the three-dimensional plot in (G).