
Figure 1.
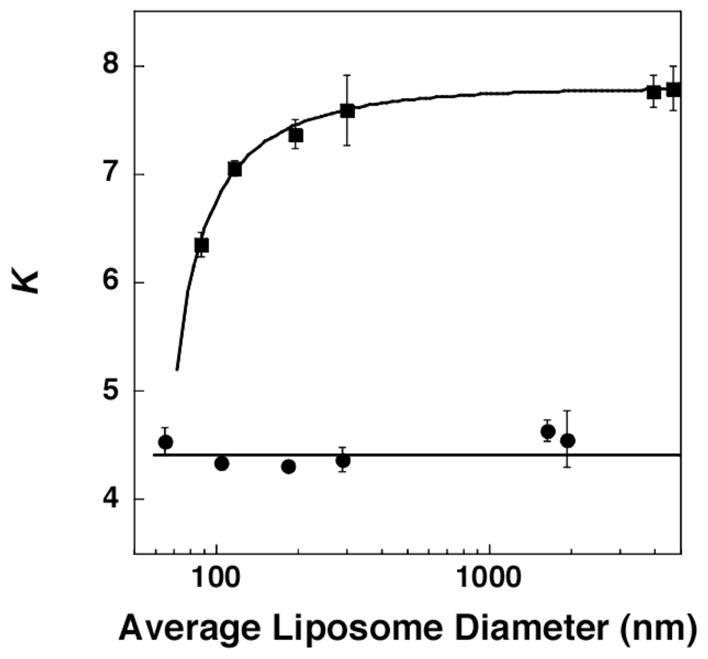
Plot of K versus the averge diameter of liposomes that were cholesterol-rich (40 mol%; ■) and cholesterol-poor (2.5 mol%; ●). All dispersions showed gaussian distributions with standard deviations that were typically 30–40% via extrusion and 50–60% for REVs (having diameters >1000 nm). Particle sizes before and after NNR reactions were essentially unchanged.19