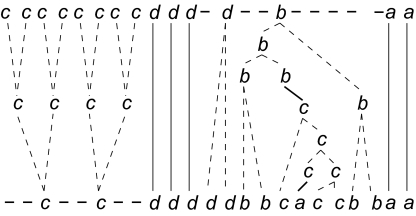
Figure 4.
An alignment produced by MS_Align: the alignment between the maps ccccccccddddbaa and ccdddddbbcaccbbaa with the costs A = C = 1, I = D = 40, ℳ(a, b) = ℳ(a, d) = ℳ(b, d) = 20, ℳ(a, c) = ℳ(b, c) = ℳ(c, d) = 10. The cost of this alignment is 14 × A + ℳ(b, c) + ℳ(c, a) = 34. Plain lines represent matches, dashed lines represent amplifications and contractions, while bold lines represent mutations. One observes several segmental operations: first the compressions of the c’s at the beginning of the upper sequence, and the generation of the substring bbcaccbb in the lower sequence from the character b of the upper sequence. The latter shows a complex succession of elementary operations.

