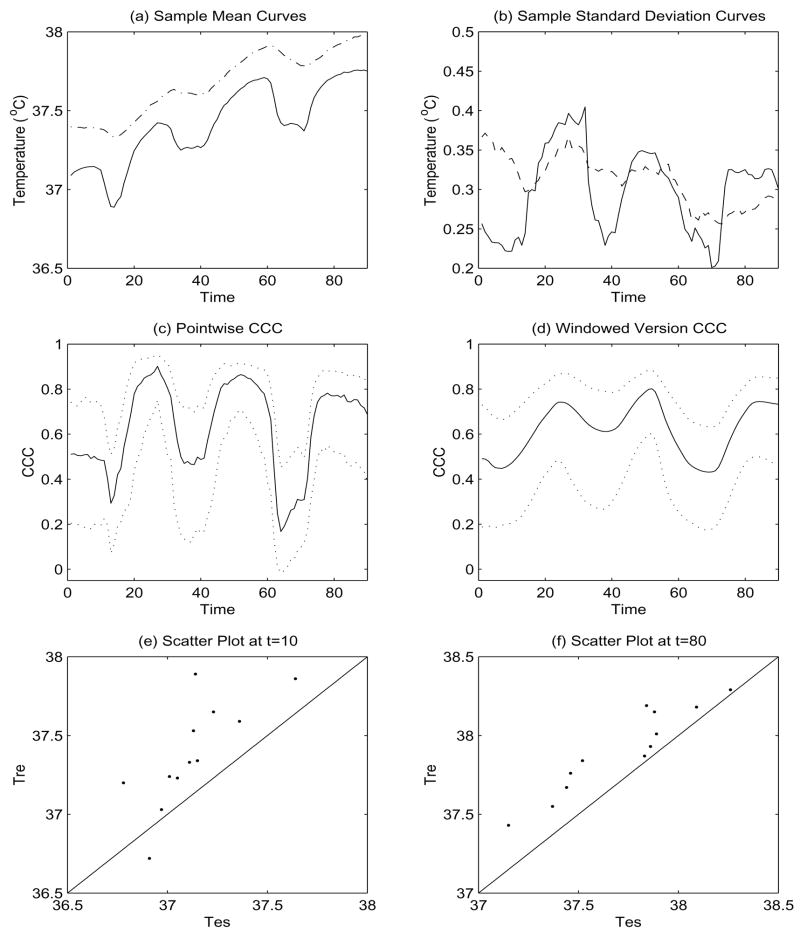
Figure 1.
Plots for Example 1. (a) and (b) are plots of the sample mean and standard deviation curves, respectively. The solid line stands for the Tes, and the dash-dotted line for the Tre. In (c) and (d), the solid line is plot of pointwise and windowed version concordance correlation coefficient, respectively, and dotted lines are the 2.5th and 97.5th percentiles of 1000 bootstrap estimates, respectively, (e) and (f) are scatter plots at t = 10 and 80, respectively.

