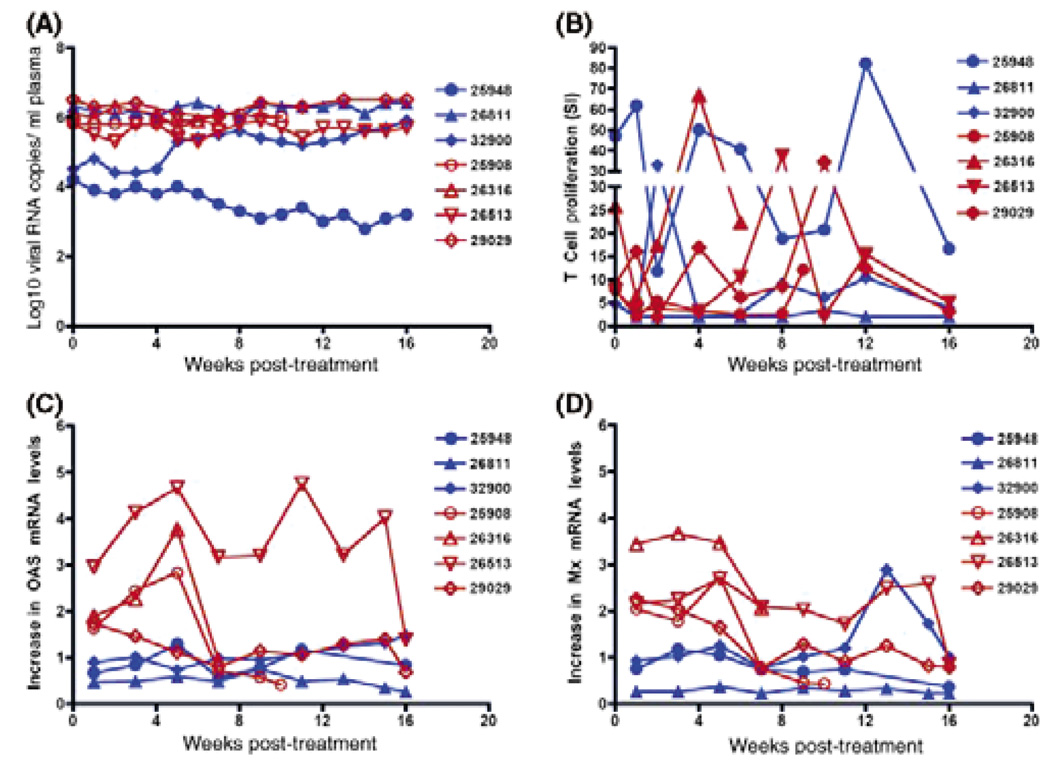
Fig. 2.
Effect of Pegasys treatment in chronic SIV-infected macaques. Panel A: Plasma viral RNA levels for Pegasys-treated (Brown symbols) and untreated (Blue symbols) monkeys are reported as log10 viral RNA copies per ml of plasma. Panel B: T-cell proliferative responses are shown for various time points after Pegasys treatment initiation. The y-axis shows the Stimulation Index (SI) as calculated by cpm of SIV-stimulated PBMC/cpm of media control cultures. Panels C and D show the increase in 2′–5′ oligoadenylate synthetase (OAS) and Mx PBMC mRNA levels, respectively, compared with OAS and Mx PBMC mRNA levels in the same animal prior to treatment.

