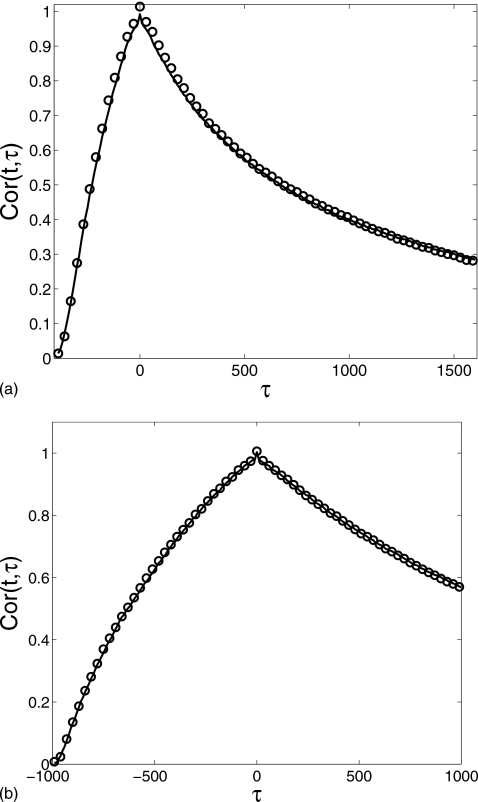
Figure 6.
Comparison of the autocorrelation function Cor(t,τ) at (a) t=400 and (b) t=1000 of the monomer M number computed for the gene regulation cascade: the Gillespie simulation (circle) and the reduced Langevin approximation (solid line). δ=0.02, α0=0.2, α1=2.0, λ=0.4, θ=50, k=0.001, and β=10 with the initial condition (m,Nϕ0,Nϕ1,n)=(0,1,0,0).

