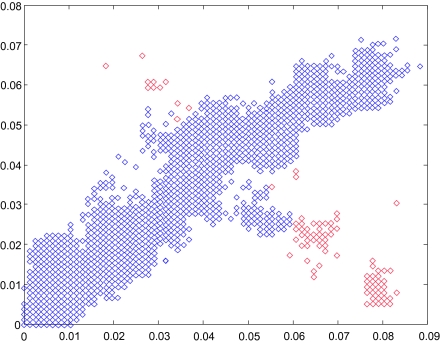
Figure 5.
Hamming distance in third codon position between human H3N2 Influenza strains in the New York state (208 sequences from 2000–2003) in segment 1 versus segment 3. Mutations accumulate at similar rates in different segments. That makes that most of the pairs are distributed along the diagonal. When reassortments occur this pattern is violated and the exchange of segments produce pairs of viruses where the distances in different segments are not proportional to each other. Reassortments appear as points outside of the diagonal. We can then proceed to analyze the sequences that are the origin of points. In red are the pairs of sequences that contain A/New York/11/ 2003(H3N2) (Rabadan, Levine and Robins, 2006).

