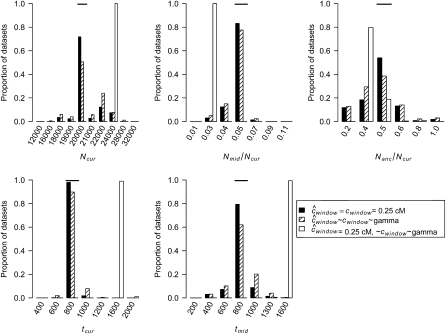
Figure 5.—
Distributions of MLEs of the five bottleneck model parameters for simulated data sets where there are errors in the genetic map.  denotes the case where there are errors in the estimated genetic map that are ignored when performing the inference.
  denotes the case where we allow for errors in the genetic map when conducting the inference. The true value of each parameter is denoted by the horizontal line in each section.

