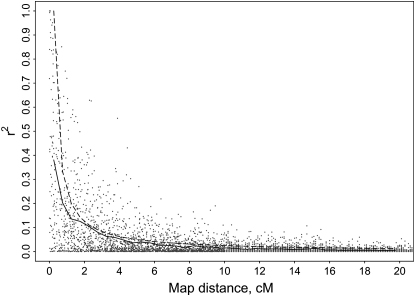
Figure 2.—
Linkage disequilibrium between QTL and HD-SNPs measured by r2 against distance in centimorgans (cM) obtained from one replicate in which 500 QTL were simulated. The solid line is the average r2 estimated for bins of length 0.5 cM. The dashed line is the predicted r2 based on the equation E(r2) = 1/(1 + 4 × 100 × θ), where 100 is the effective population size and θ is the recombination frequency.

