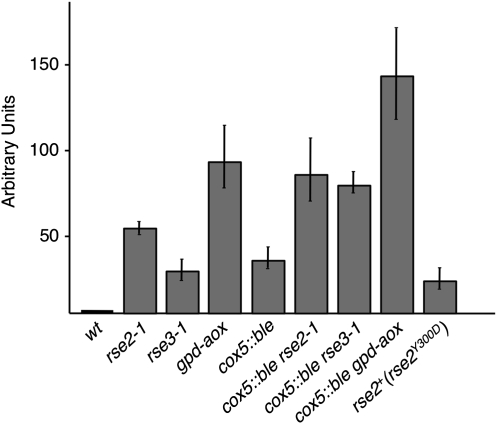
Figure 3.—
Relative abundance of aox transcripts. For each strain, the levels of aox and gpd transcripts were determined by quantitative RT–PCR performed on one to three different RNA preparations (one to three replicates). For each experiment, the level of aox transcripts was normalized using the level of gpd transcripts as a reference. The graph shows the level of aox transcripts relative to the level of aox transcripts in the wild type for each strain. The error bars correspond to standard error. The rse2+(rse2Y300D) strain corresponds to a strain in which an ectopic copy of the mutated rse2Y300D has been integrated.

