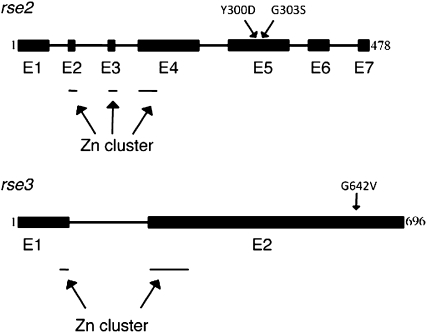
Figure 4.—
Structure of the rse2 and rse3 genes. The amino acids mutated in the rse2 gene (top) and the rse3 gene (bottom) are indicated. Exons (E) are shown as solid boxes and introns as solid lines. The first and the last amino acids of each protein are indicated. Sites within exons that contain a motif identified as a possible zinc cluster are indicated by thin lines below the genes.

