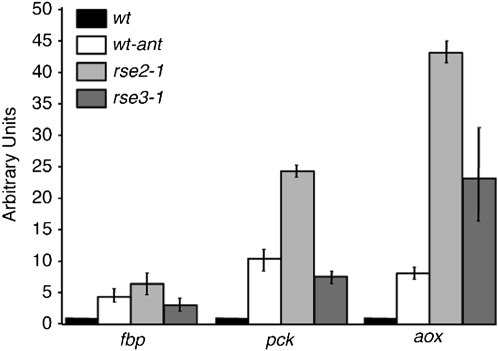
Figure 5.—
Quantification of fbp, pck, and aox expression. Total RNA was extracted from cultures of the wild-type strain grown under normal conditions (solid) or in the presence of antimycin A (10 μg/ml) (open) and from cultures of the rse2Y300D (light shading) and rse3G642V (dark shading) mutants grown under normal conditions. qPCR reactions were performed on cDNA to quantify the level of fbp, pck, aox, and gpd transcripts in each strain. Experiments were performed at least three times. As in Figure 3, in each experiment, the level of fbp, pck, and aox transcripts was normalized using the level of gpd transcripts as a reference. The diagram shows the level of fbp, pck, and aox transcripts in the different strains and culture conditions relative to the level of these transcripts in the wild type. The error bars correspond to standard error.

