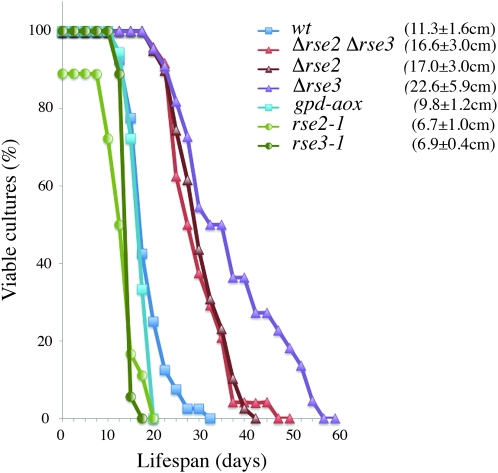
Figure 6.—
Life-span analyses. For each genotype, at least 18 subcultures (representing the two mating types) were grown on M2 medium at 27° in race tubes. Data were plotted as the cumulative survival in time using Kaplan–Meier estimates. The mean longevity in centimeters ± standard error is in parentheses.

