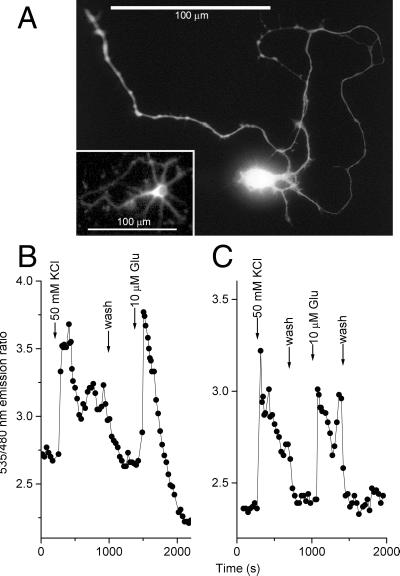
Figure 3.
Measurement of [Ca2+]c in hippocampal neurons using YCs. (A) Individual neuron expressing YC2.1 for 24 h, digitized from a photomicrograph. (Inset) The actual cell monitored in C; resolution was reduced by the 2 × 2 binning of the camera. (B and C): [Ca2+]c in individual cultured hippocampal neurons (7 days in vitro) 24 h after transfection with YC2 (B) or YC2.1 (C). Note the pH artifact in A after stimulation with 10 μM glutamate, resulting in an apparent drop of the emission ratio.

