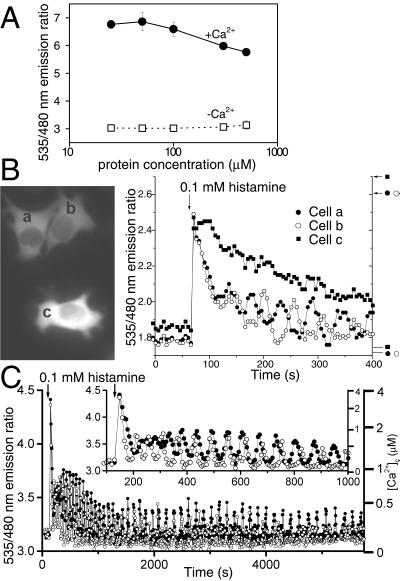
Figure 4.
(A) Concentration effects on emission ratios of YC2.1 in a cuvette at pH 7.3 in the presence of 100 μM CaCl2 (●) and 100 μM EGTA (□). Each data point represents the mean of 10–15 determinations. (B) The effects of two different concentrations of YC3.1 on histamine-induced Ca2+ transients in HeLa cells. Indicator concentrations were estimated to be 150 μM in cells a and b and 500 μM in cell c. (Left) Fluorescence images of the three cells. (Right) Time courses of emission ratios from cells a (●), b (○), and c (■). The arrows and horizontal bars on the right indicate Rmax and Rmin, respectively. (C) Oscillations in [Ca2+]c induced by 0.1 mM histamine in two HeLa cells expressing 40 μM YC3.1. ECFP emission was read with a 480 ± 15 nm filter. (Inset) The initial response on an expanded time scale.

