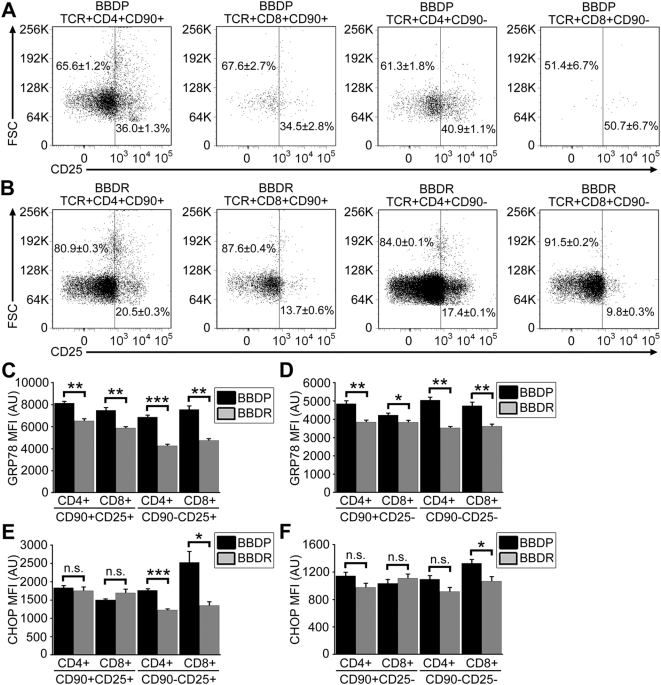
Figure 5. Enhanced ER stress response signaling in Gimap5−/− BBDP rat T cells is not dependent upon activation status.
Representative flow dot plots depicting CD25 expression (horizontal axis) and forward scatter (vertical axis) of lymphocytes within gated CD4+ and CD8+ RTEs and mature T cells from BBDP (A) and BBDR (B) rats. Numbers represent the percentage (±SEM of triplicate samples) of corresponding CD25− and CD25+ T cells. Bar graphs displaying the MFI of intracellular GRP78 and CHOP expression in CD25+ (C,E) and CD25− (D,F) T cells. Error bars represent the SEM; data shown are representative of three independent experiments (*P<.05; **P<.01; *** P<.001).

