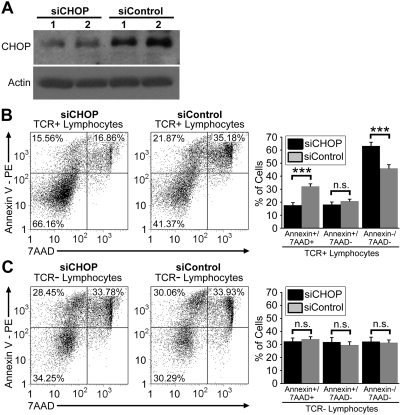
Figure 6. Knockdown of CHOP protein expression enhances the viability of T cells from Gimap5−/− rats.
(A) Western blot analyses of the ER stress apoptotic factor CHOP in purified T cells transfected with either CHOP siRNA (siCHOP) or non-specific control siRNA (siControl). Shown are results of two separate knockdown experiments. Actin was used as a loading control. (B,C) Representative flow dot plots depicting cells positive for annexin V (vertical axis) and 7AAD staining (horizontal axis) on gated TCR+ or TCR− lymphocytes. Bar graphs display the percentage of TCR+ or TCR− lymphocytes that were positive for both annexin V and 7AAD staining (left), positive for annexin V staining alone (middle), and negative for both staining (right). Error bars represent the SEM of quadruplicate samples; data shown are representative of two independent experiments (*** P<.001).

