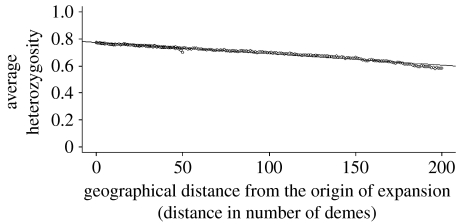
Figure 1.
Plot of average heterozygosity with geographical distance from the origin of expansion. Carrying capacity of deme K=1000, colonization rate=0.13 and exchange rate among neighbouring demes=0.001. The correlation coefficient is −0.987. The intercept of the regression line is 0.774 and the total fall in heterozygosity is 0.16812. There are two boundary effects visible in the otherwise perfectly linear pattern. The boundary effect at a distance 50 from the origin of expansion is due to the populations near the left edge of the grid. The boundary effect at a distance close to 200 from the origin of expansion is due to the populations near the right edge of the grid. There is no boundary effect at the origin of expansion.

