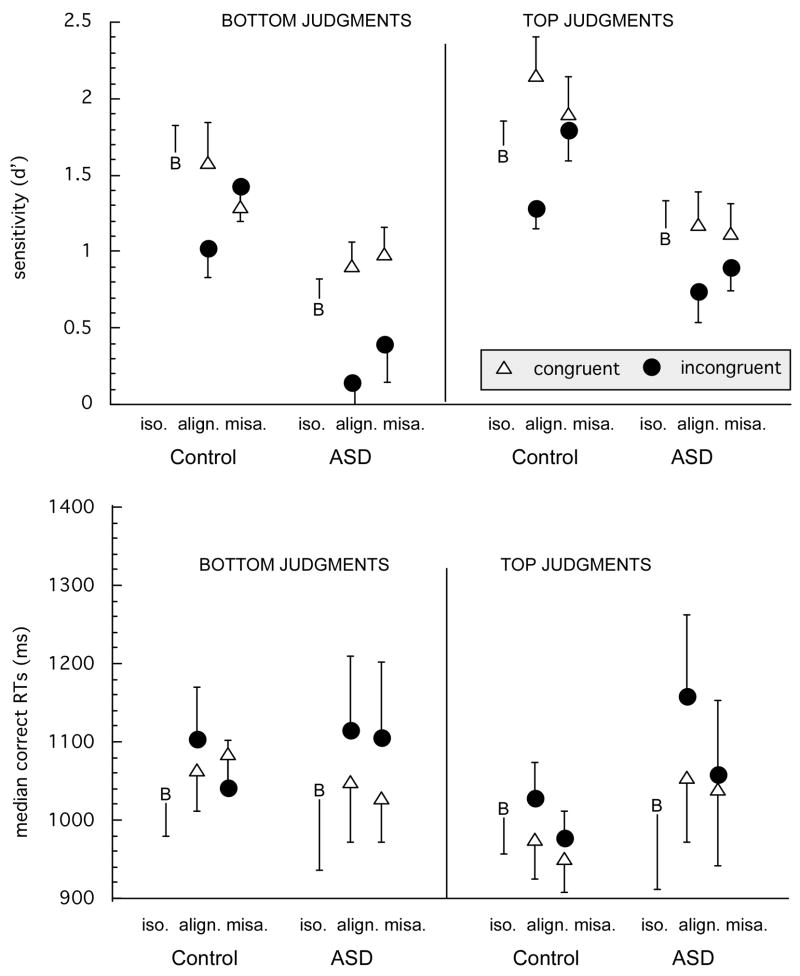
Figure 3.
Mean sensitivity (TOP) and median response times for correct responses (BOTTOM) in the different conditions as a function of group, part, configuration and congruency. B denotes baseline trials in the isolated part condition, which are neither congruent nor incongruent. Error bars show the standard error of the mean in each condition.

