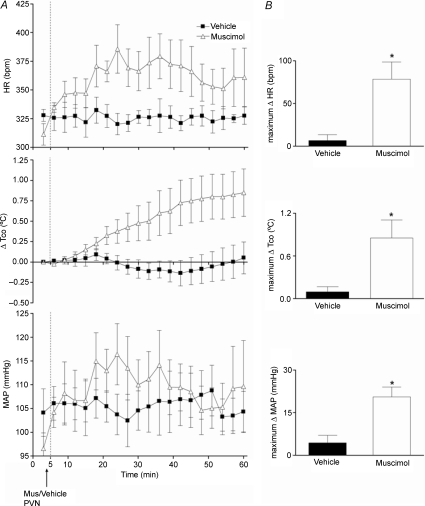
Figure 6. Effect of injection of muscimol or saline into PVN on baseline HR, MAP and Tco (n= 4).
A, mean values for heart rate (HR) and mean arterial pressure (MAP) and mean changes from baseline for core body temperature (Tco) over time (min) after microinjection of vehicle (100 nl, black squares) or muscimol (100 pmol/100 nl, grey triangles) into l/dlPAG at t= 5 min. Baseline Tco: saline, 37.8 ± 0.3°C; muscimol, 37.5 ± 0.2°C. B, maximum changes in Tco after microinjection of vehicle or muscimol into PVN. *Significant difference between response to microinjection of muscimol versus saline into PVN by paired t test, P < 0.05.

