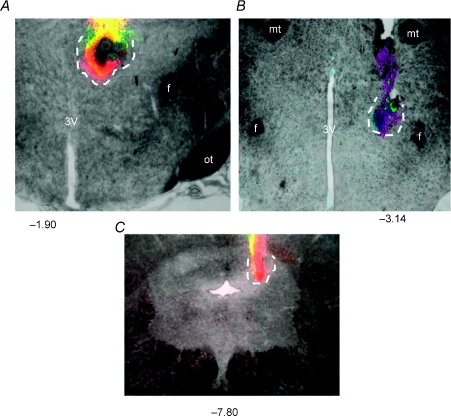
Figure 8. Photomicrographs depicting examples of sites of injection in the PVN (A), the DMH (B) and the l/dlPAG (C).
All drugs were mixed with fluorescent microspheres to mark the site. Approximate extent of spread of beads at injection sites is indicated by dotted line. Numbers represent distance from bregma in millimeters. 3V, third ventricle; f, fornix; mt, mammillothalamic tract; ot, optic tract.

