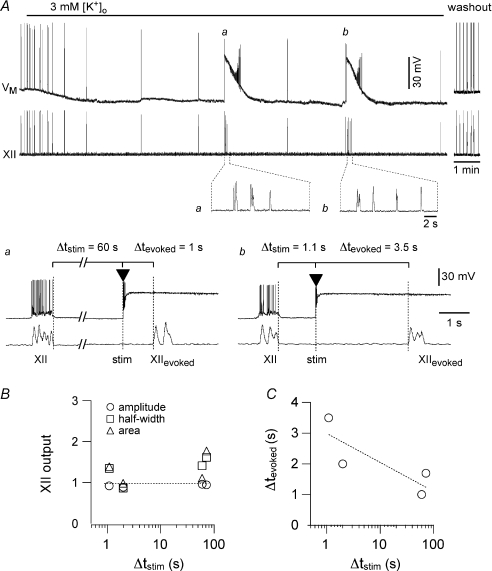
Figure 3. Transient local stimulation with AMPA pulses evokes XII motor output (XIIevoked) following short (∼1 s) and long (60 s) intervals following endogenous XII output.
The interval of stimulation following endogenous XII output is defined as Δtstim. A, lowering [K+]o from 9 to 3 mm slowed the respiratory rhythm to 0.008 Hz. The top trace (VM) shows a whole-cell recording from a neuron in the preBötC. Baseline voltage was −60 mV at the start of the sweep. The lower trace shows XII output. Lower insets show XIIevoked cycles at higher sweep speed following long (a) and short (b) stimulation. The 2 s calibration bar applies to both inset traces. a, after two successive cycles with a period of ∼120 s, local AMPA stimulation was applied 60 s after the endogenous XII output (i.e. Δtstim= 60 s), which evoked three rapid cycles of XIIevoked with a latency (Δtevoked) of 1 s. b, after the first stimulation protocol (a), the cycle period returned to ∼120 s, and after two consecutive cycles, another local AMPA stimulation was applied 1.1 s following the endogenous XII output (i.e. Δtstim= 1.1 s), which evoked four rapid cycles of XIIevoked with a latency (Δtevoked) of 3.5 s. B, the normalized amplitude (open circles), half-width (open squares), and area (open triangles), of XIIevoked from the experiment in A are plotted versus Δtstim. C, Δtevoked of the bursts from the experiment shown in A are plotted versus Δtstim. The dotted line in B is a horizontal reference for normalized XII output = 1; dotted line in C is a linear regression fit to the data.

