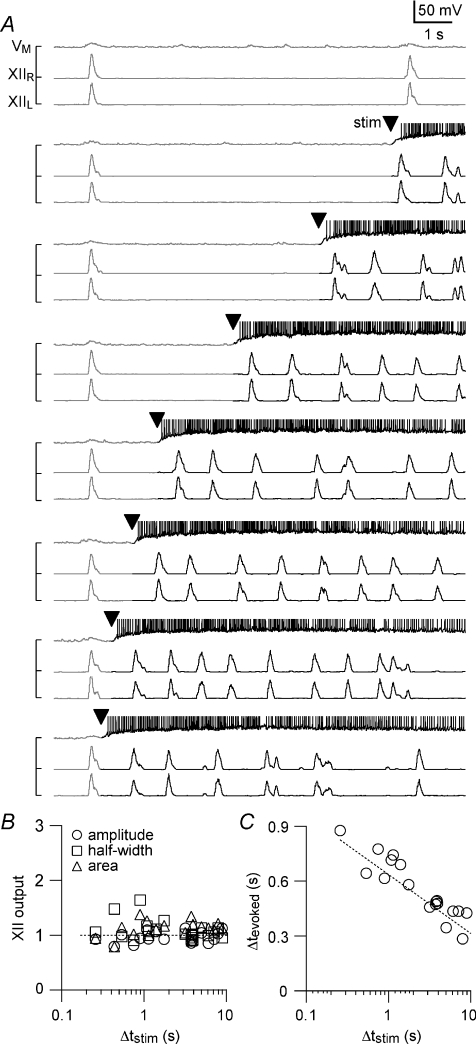
Figure 4. Transient local stimulation with AMPA pulses evokes XII output, similar to bursts recorded endogenously, at a range of intervals following endogenous XII output.
A, the interval of stimulation following endogenous XII output is defined as Δtstim. The experiment was performed with [K+]o= 9 mm such that the endogenous frequency was ∼0.1 Hz in this slice. The top trace (VM) shows a whole-cell recording from a neuron in the preBötC with baseline voltage at −60 mV at the start of each sweep. The voltage axis was truncated for display such that action potentials are not shown in their entirety. The lower traces show left and right XII output. Moving from the top to the bottom of the panel, transient local AMPA stimulation (5× pulses, arrowhead) was applied at progressively shorter Δtstim, starting with Δtstim= 9 s and finishing with Δtstim= 0.2 s. Endogenous rhythmic activity is displayed with grey whereas the evoked activity is black for emphasis. B, the amplitude (open circles), half-width (open squares), and area (open triangles) of XIIevoked from the experiment shown in A are plotted versus Δtstim. C, Δtevoked from the experiment shown in A is plotted versus Δtstim. The dotted line in B is a horizontal reference for normalized XII output = 1; dotted line in C is a linear regression fit to the data.

