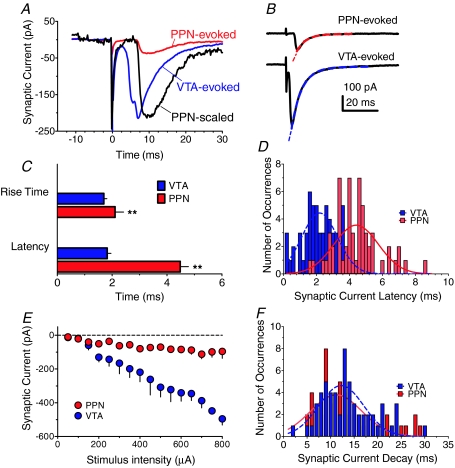
Figure 2. Distinct physiological properties of PPN- and intra-VTA-evoked synaptic currents in VTA neurons.
A, representative examples of mean synaptic currents evoked by PPN (red) or intra-VTA (blue) single-pulse stimulation in the same VTA neuron. Note the longer latency of the PPN-evoked current, evident in the scaled PPN response (black). B, single-exponential decay time constants (τ) for PPN- and VTA-evoked synaptic currents in the same VTA neuron. The τ values were 5.4 ms and 5.9 ms for the PPN- (red line) and VTA-evoked (blue line) responses, respectively. C, mean 10–90% rise times and synaptic latencies for currents evoked by PPN and intra-VTA stimulation in the same neurons (n= 58 cells). Both the rise times and latencies were significantly slower for the PPN-evoked responses (P < 0.01, ANOVA). D, histograms and Gaussian curve fits showing the distribution of latencies for PPN and intra-VTA evoked synaptic currents measured in the same VTA neurons (n= 58). Bin width = 0.2 ms. E, input–output relationship for PPN- and intra-VTA-evoked synaptic currents in the same VTA neurons across a range of stimulus intensities (n= 6 neurons). F, histograms and Gaussian curve fits showing the distribution of decay times (90–10% of peak amplitude) for PPN and intra-VTA-evoked synaptic currents in the same VTA neurons (n= 81).

