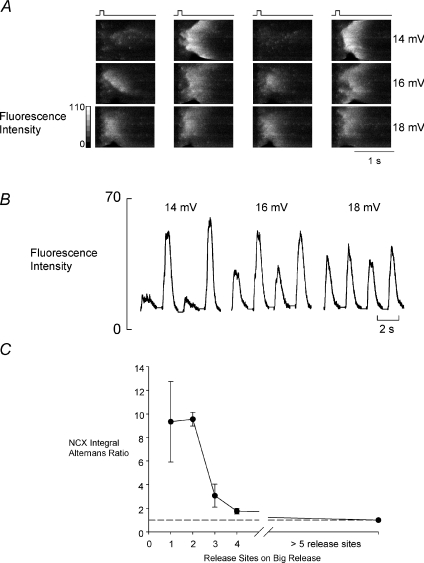
Figure 2. The steady state effects of depolarization amplitude on the spatial characteristics of Ca2+ release during alternans.
A, line scans. From left to right are shown the responses to four consecutive depolarizing pulses (applied at the times indicated above). Top to bottom shows the response to depolarizing pulses of the amplitudes shown at the right. The vertical dimension of the linescan is 75 μm. B, average value of fluorescence from the linescans in A. C, graph showing the alternans ratio (measured from the integrated NCX currents as in Fig. 1B in a total of between 2 and 8 cells) as a function of the number of initiating sites observed on the larger responses.

