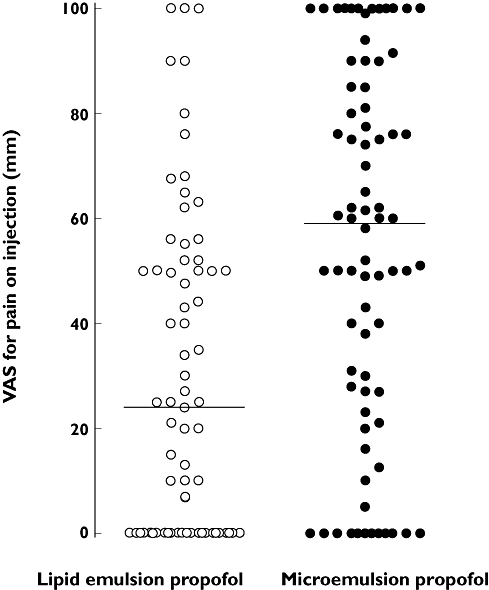
Figure 2.

The distribution of visual analogue scale (VAS) scores for pain on injection with an intravenous bolus (30 mg) of microemulsion (•) or lipid emulsion (○) propofol in 147 patients (VAS, 0 mm = no pain, 100 mm = worst pain imaginable). The solid horizontal lines represent median VAS scores for pain on injection with microemulsion and lipid emulsion propofol (59 and 24 mm, respectively, P < 0.001 by Mann–Whitney rank sum test)
