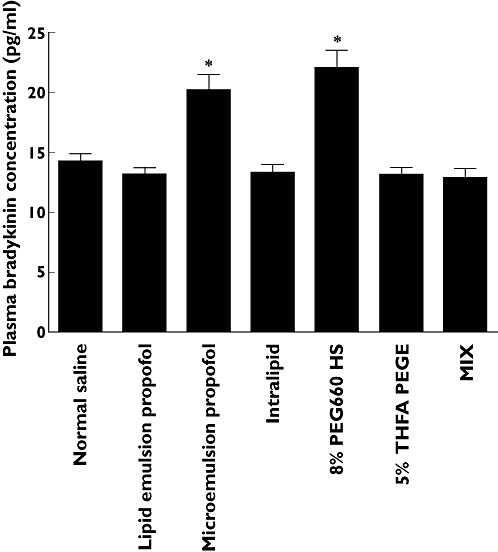
Figure 3.

The concentration of bradykinin in plasma obtained after mixing 3.5 ml venous blood, sampled from six healthy volunteers, with 1.5 ml normal saline [control, 14.2 ± 1.6, coefficient of variation (CV) 11.5%, 95% confidence interval (CI) 12.5, 15.9], lipid emulsion propofol (13.2 ± 1.3, CV 10.2%, 95% CI 11.8, 14.6), 10% lipid solvent (Intralipid 13.3 ± 1.6, CV 12.1%, 95% CI 11.6, 15.0), microemulsion propofol (20.2 ± 3.2, CV 16.0%, 95% CI 16.8, 23.6), 8% polyethylene glycol 660 hydroxystearate (PEG660 HS, 22.0 ± 3.6, CV 16.4%, 95% CI 18.3, 25.8), 5% tetrahydrofurfuryl alcohol polyethylene glycol ether (THFA PEGE, 13.2 ± 1.4, CV 10.5%, 95% CI 11.7, 14.6) and a mixture of other ingredients in microemulsion propofol minus propofol, polyethylene glycol 660 hydroxystearate and tetrahydrofurfuryl alcohol polyethylene glycol ether (MIX, 12.9 ± 1.8, CV 14.3%, 95% CI 11.0, 14.9). *P < 0.05 vs. normal saline by the Holm–Sidak method. Data are presented as mean ± SD. CV, SD/mean × 100%; CI, confidence interval of population mean
