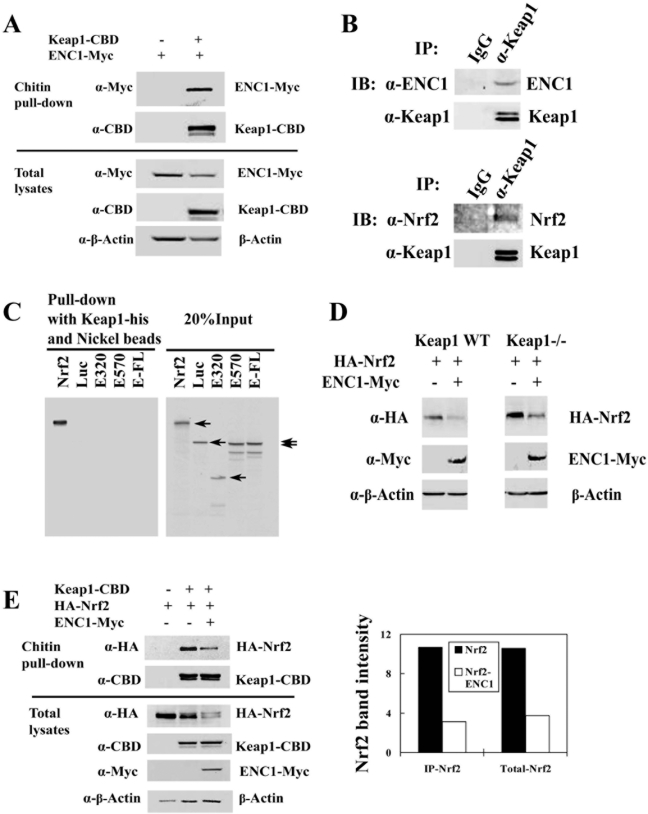
Figure 4. Keap1 was not essential in ENC1-mediated down-regulation of Nrf2.
A. MDA-MB-231 cells were transfected with an expression vector for ENC1-Myc, along with an empty vector or an expression vector for Keap1-CBD. Cell lysates were subjected to chitin pull-down assay. Precipitated proteins were subjected to immunoblot analysis with anti-Myc and anti-CBD antibodies for detection of Keap1-CBD and ENC1-Myc (top panel). Small aliquots of total lysates were analyzed by immunoblot with the indicated antibodies (bottom panel). B. Cell lysates from MDA-MB-231 cells were immunoprecipitated with anti-Keap1 antibody. The precipitated protein complexes were subjected to immunoblot analysis with anti-Nrf2 and anti-ENC1 antibodies. IgG was included in the immunoprecipitation analysis as a negative control. C. Plasmids for full-length ENC1 (E-FL) and two ENC1 deletion mutants E320 and E570, Nrf2 and Luciferase (Luc) were used for in vitro transcription/translation to synthesize [35S]-labeled proteins. The proteins were incubated with Keap1-His purified from E. Coli. Protein complexes containing Keap1 were pulled-down with nickel beads and resolved in SDS-PAGE and detected by autoradiography. Nrf2 and Luciferase were used as a positive and a negative control. 20% of [35S]-labeled proteins were resolved by SDS-PAGE gel to show equivalent input of each protein (right panel). D. Keap1-/- and wild-type MEF cells were transfected with plasmids for HA-Nrf2 and ENC1-Myc. Cells were lysed at 48 hr post-transfection. Cell lysates were analyzed by immunoblot with anti-HA, anti-Myc and anti-β-actin. E. Cell lysates from MDA-MB-231 cells transfected with plasmids for Keap1-CBD, HA-Nrf2, and ENC1-Myc were used for pull-down assay with chitin beads Precipitated proteins were subjected to immunoblot analysis with anti-HA and anti-CBD antibodies (left figure, top two panels). Small aliquots of total lysates were analyzed by immunoblot with the indicated antibodies (left figure, bottom four panels). Nrf2 and β-Actin band intensities were quantified using Quantity One (BIO-RAD). The intensity of Nrf2 was normalized to that of β-actin (right graph).

