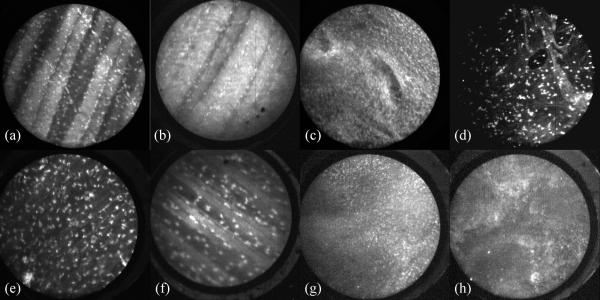
Figure 1.
Images of mouse tissue obtained with the confocal microendoscope. AO was used as a contrast agent in the top row of images, and SYTO 16 was used on tissues shown in the lower images. (a, b, e, and f) are of the peritoneal wall, (c,g) are images of the surface of the ovaries, and (d,h) show images of a tumor. All images shown were obtained with bare fiber catheter, except b and f, which used a catheter with a miniature objective to achieve higher magnification.

