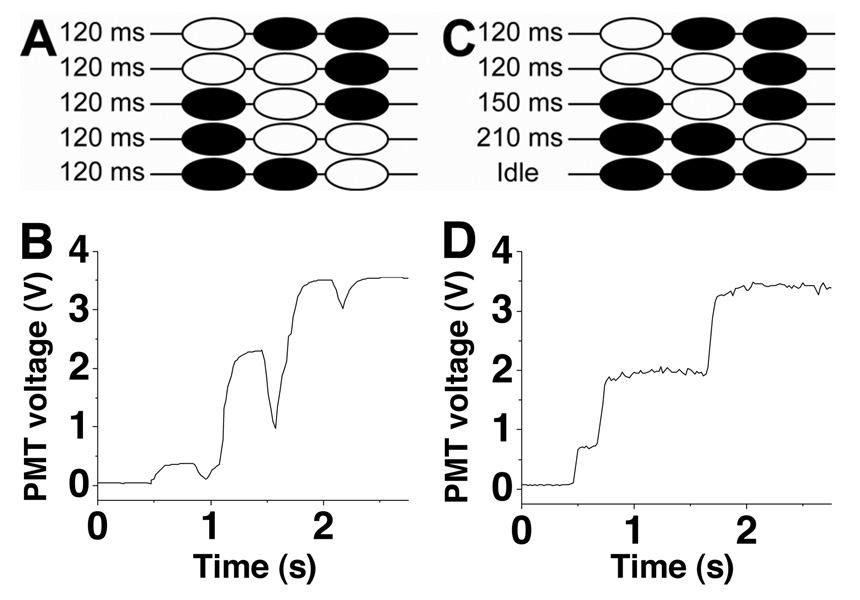
Figure 2. Reduction of backflow.
A. Valving sequence using the original sequence of opening and closing the valves (from reference 25). White and black valves indicate open and closed valves, respectively. B. Using the valving sequence described in A, the fluorescence intensity of fluorescein was pumped through the detection region. Decreases at 1 s, 1.6 s, and 2.1 s were due to backflow. C. The new pumping sequence shown with the same coloring scheme as in A. D. Using the valving sequence described in C, the fluorescence from fluorescein pumped through the detection region is shown.

