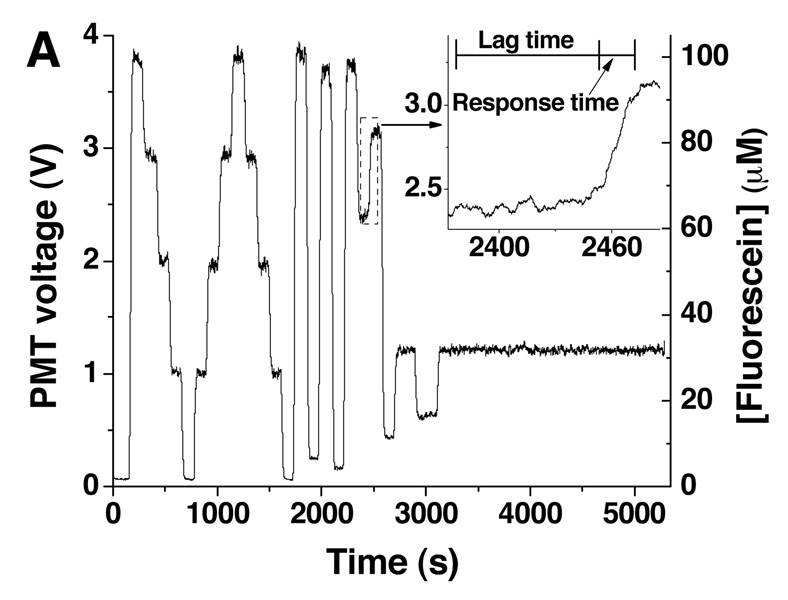
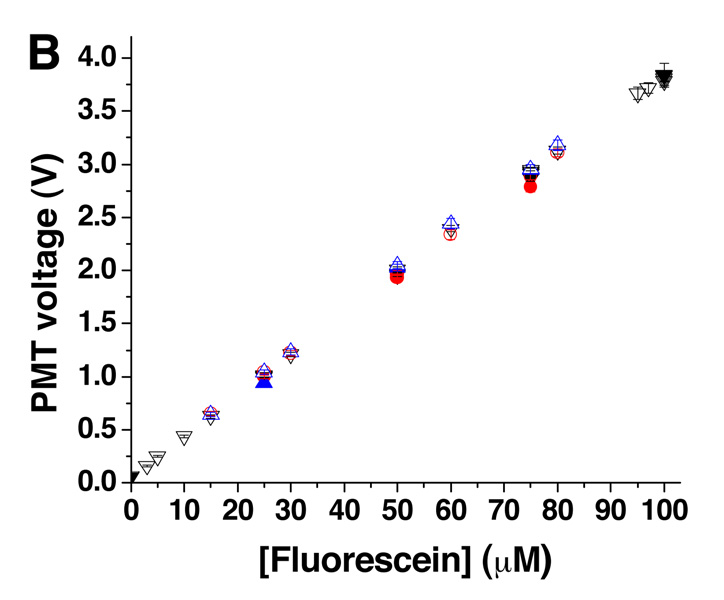
Figure 3. Online-mixing of fluorescein.
A. Online mixing of 100 µM fluorescein was performed to produce final concentrations of 0, 25, 50, 75, and 100 µM fluorescein (n = 3) followed by dilutions to 3, 5, 10, 15, 30, 60, 80, 95, and 97 µM. The inset shows the time course of the change from 60 to 80 µM. The times corresponding to the lag and response time are indicated. B. Average PMT readings for each of the different online-mixed concentrations (open symbols) were plotted against the intended final concentration. Offline-mixed fluorescein solutions at concentrations of 0, 25, 50, 75, and 100 µM are plotted on the same graph (closed symbols). Shown on this graph are the results of three assemblies of the microfluidic device and PMMA manifold corresponding to black, blue, and red symbols.


