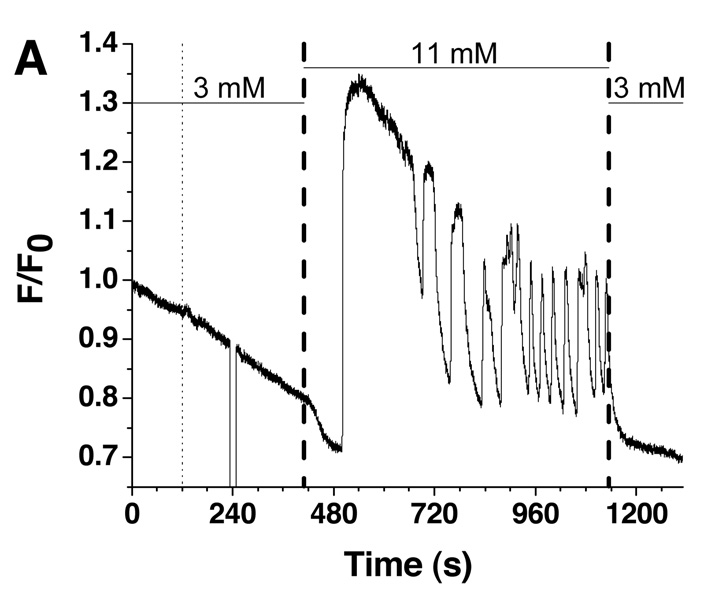
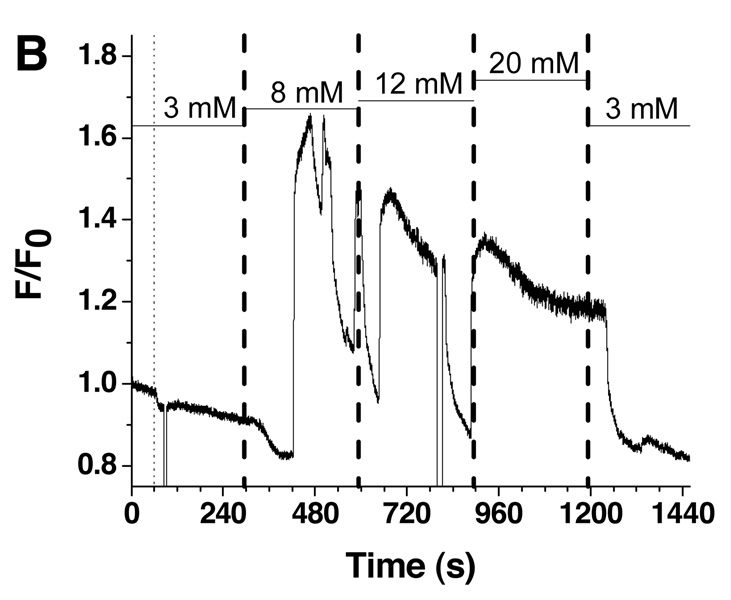
Figure 5. Single islet [Ca2+]i responses to glucose stimulation.
A. Fluo-4 fluorescence from a single islet was measured as a function of time in response to a single step change in glucose concentration. The glucose concentration in the perfusion system was changed as shown by the horizontal bars above the fluorescence trace. The thin dashed line represents the time the pumping commenced while the thick dashed line indicates the time the glucose entered the cell chamber as estimated by the average flow rate and response time of the system. The error in the flow rate and response time measurements is shown by the thickness of the dashed lines. B. A second glucose waveform was applied in steps from 3, 8, 12, 20, and back to 3 mM.


