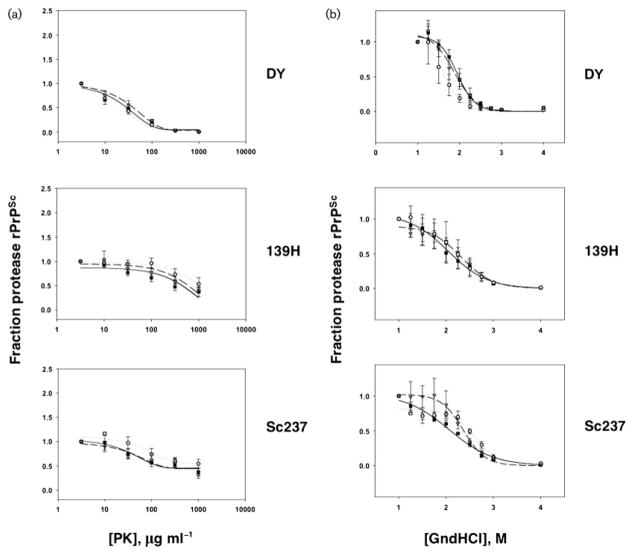
Fig. 4.
Biochemical analysis of PrPSc stability. (a) Protease resistance assay showing PrPSc levels in samples of brain homogenates taken from animals inoculated with samples derived from different prion strains, as indicated, and incubated with various concentrations of PK as described in Methods. (b) Guanidine denaturation assay showing PrPSc levels in samples of brain homogenates taken from animals inoculated with samples derived from different prion strains, as indicated, and incubated with various concentrations of guanidine hydrochloride, as described in Methods. (a and b) Symbols: black squares, animals inoculated with control scrapie brain homogenate; open circles, animals inoculated with PrP27–30 samples; grey triangles, animals inoculated with sonicated samples. The mean values of replicates (n=3) are shown for each point ± SEM.

