
Fig. 6.
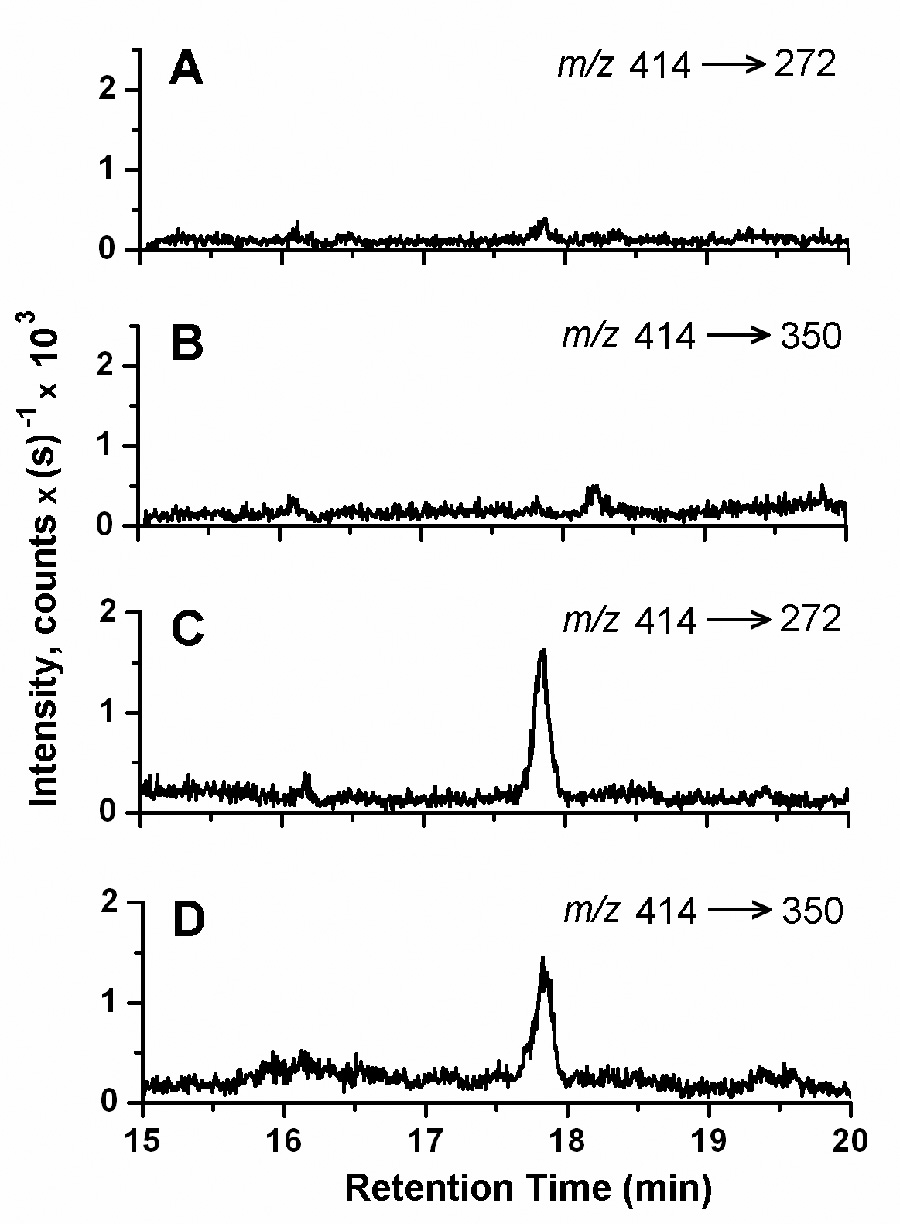
MRM analysis of the CS-FBS blank and for E2 in serum at the LLOQ. The reconstructed ion chromatograms for (A) m/z 414 → 272 and (B) m/z 414 → 350 from the analysis of a CS-FBS blank and for (C) m/z 414 → 272 and (D) m/z 414 → 350 of a CS-FBS sample spiked at 10 pg/mL are shown. The signal-to-noise ratios for the peaks representing the PS derivative of E2 at 17.8 min in (C) and (D) are 8.2 and 5.7, respectively.