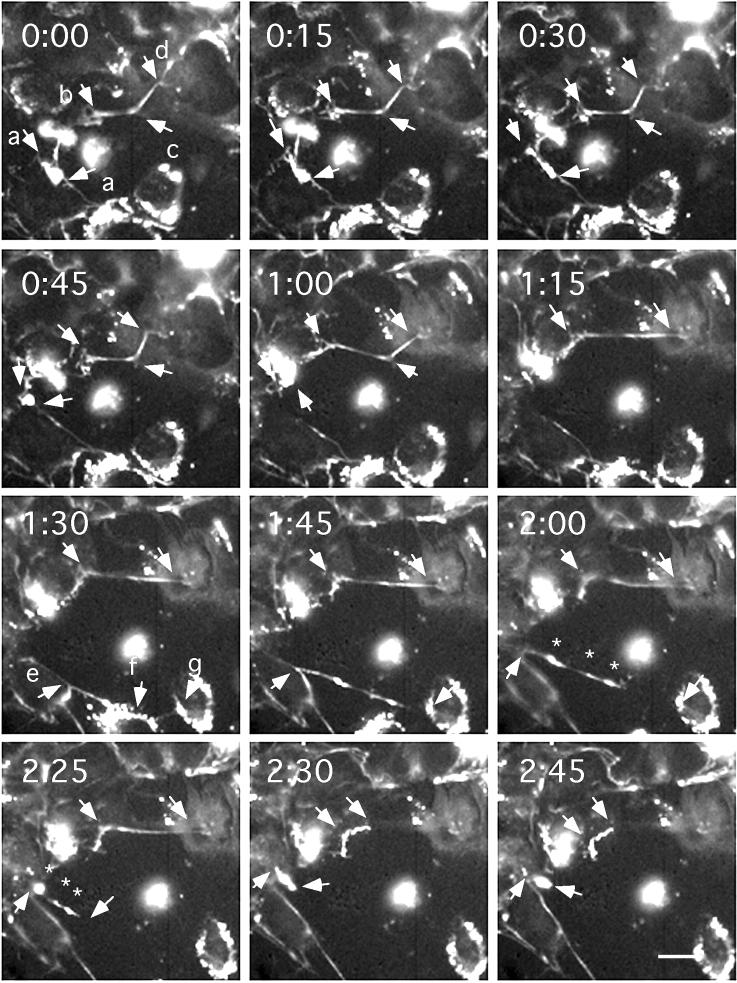
Figure 3.
The elasticity of FN matrix fibrils demonstrated by exceptionally large movements and breakages. Specific movements are discussed in the text. Images were originally taken at 5-min intervals after 15 h of culture. Arrows indicate fibril ends or predicted cell adhesion sites. (Bar = 20 μm.) A digital movie of this sequence is published as supplemental material on the PNAS web site (www.pnas.org).

