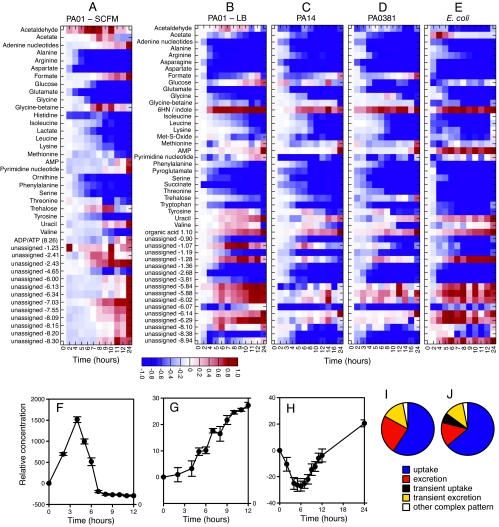
FIG. 2.
Metabolite changes in different media and different strains across the course of growth. (A to E) Heatmaps. Each row represents a metabolite or a peak from an as-yet unassigned metabolite. Blue indicates a decrease in concentration, and red indicates an increase in concentration. Note that panels B to E can be directly compared visually but that the metabolites in panel A do not line up directly with B to E. The row for metabolite “6HN/indole” represents 6-hydroxynicotinate for P. aeruginosa strains and indole for E. coli. (A) P. aeruginosa PA01, SCFM; (B) P. aeruginosa PA01, LB; (C) P. aeruginosa PA14, LB; (D) P. aeruginosa PA0381, LB; (E) E. coli, LB. Selected metabolites with different modes of utilization and/or production are then shown in detail in the bottom half of the figure (error bars represent ± the standard errors of the mean). (F) Acetate, E. coli, showing a transient increase in metabolite concentration; (G) unassigned metabolite, E. coli, showing a peak at δ 1.10 ppm and a steady increase in metabolite concentration; (H) formate, P. aeruginosa PA01, LB, showing a transient decrease in metabolite concentration followed by subsequent production. (I and J) Overall comparison of the different modes shown as pie charts (indicating the percentage of assigned metabolites that changed in some way during growth). (I) P. aeruginosa PA01, SCFM; (J) P. aeruginosa PA01, LB.

