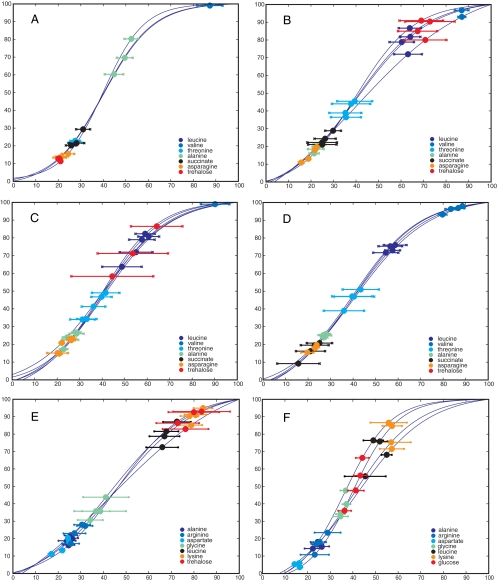
FIG. 4.
Uptake window plots for seven example compounds for all four bacterial strains. The compound t50 is back-projected upon the actual culture growth curve, i.e., all biological replicates are shown. The “error bars” represent the calculated width (see Fig. 2 for an illustration of t50 and width). Note that both the abscissa (time) and ordinate (OD600) have been scaled such that growth curve maxima are set at 100%, to facilitate comparison across different strains. (A) E. coli; (B) P. aeruginosa PA01; (C) P. aeruginosa PA14; (D) P. aeruginosa PA0381. The remaining two panels compare uptake windows for P. aeruginosa PA01 for two different media: (E) LB and (F) SCFM. Note that glucose is plotted (not trehalose as for panel A), since glucose is higher concentration in SCFM.

