FIG. 5.
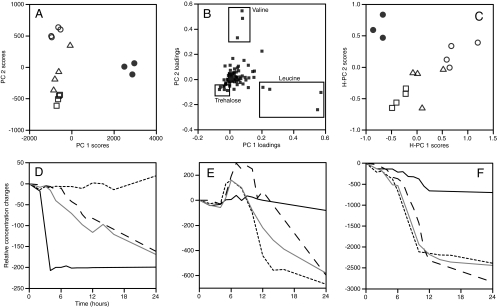
(A) PCA for 12-h data, score plot of axes 1 and 2. Symbols: •, E. coli; ○, P. aeruginosa PA01; ▵, P. aeruginosa PA14; □, P. aeruginosa PA0381. Principal components 1 and 2 explained 87 and 8% of the variance in the data, respectively. (B) Loadings plot for the analysis shown in panel A. Variables corresponding to assigned metabolite bins for leucine, valine, and trehalose are labeled directly on the plot. (C) H-PCA of fitted time course data. Figure symbols are the same as for panel A. Principal components 1 and 2 explained 50 and 33% of the variance in the data, respectively. (D) Trehalose utilization during growth for four strains. The solid black line represents E. coli, the solid gray line represents P. aeruginosa PA01, the dashed line (long dashes) represents P. aeruginosa PA14, and the dashed line (short dashes) represents P. aeruginosa PA0381. (E) Valine utilization during growth for four strains. Lines are as defined for panel D. (F) Leucine utilization during growth for four strains. Lines are as defined for panel D.

