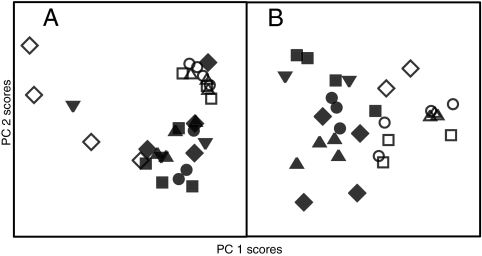
FIG. 6.
Comparison of single-time-point and nonlinear fitted metabolite data for four B. cepacia (open symbols) and five B. cenocepacia (filled symbols) isolates as principal component score plots, axis 1 versus axis 2. Different symbol shapes represent different individual isolates. (A) Single-time-point analysis does not discriminate all isolates into species. Principal components 1 and 2 explained 55 and 39% of the variance in the data, respectively. (B) Fitted metabolite data (TReF) show that species are discriminated along principal component 1 across different isolates. Principal components 1 and 2 explained 35 and 25% of the variance in the data, respectively.

