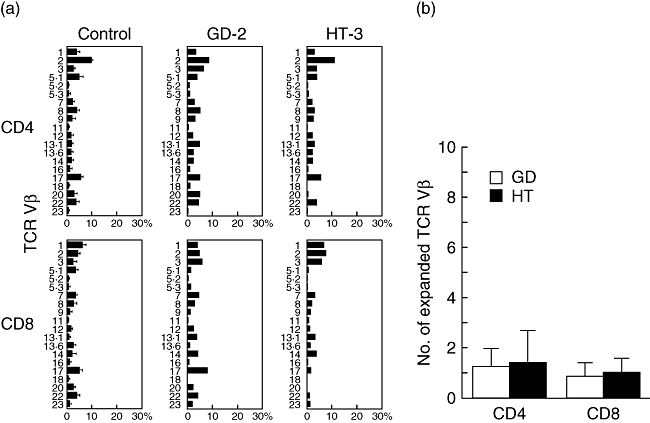
Fig. 3.

Flow cytometric analysis of T cell receptor (TCR) Vβ. (a) Expression profiles of TCR Vβ subfamilies. Peripheral blood samples were stained with monoclonal antibodies (mAbs) for individual TCR Vβ together with anti-CD4 and anti-CD8 mAbs. The percentage of each TCR Vβ expression within CD4+ and CD8+ T cells was analysed by flow cytometry. (b) Frequency of expanded TCR Vβ repertoire. Shown are the mean (±standard deviation) numbers of expanded TCR Vβ obtained from CD4+ and CD8+ T cells of patients with Graves’ disease and Hashimoto's thyroiditis.
