
Fig. 2.
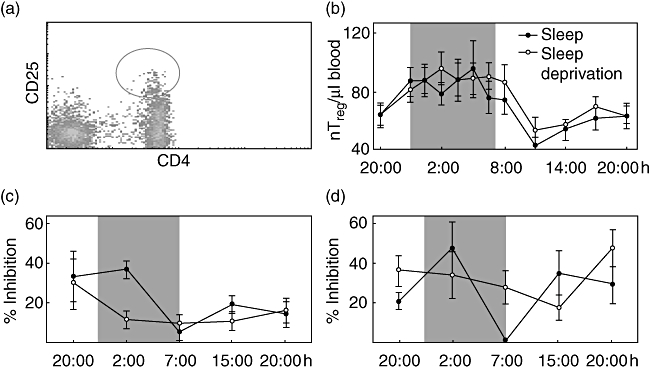
Absolute counts of natural T regulatory (nTreg) and suppression of CD4+ T cell proliferation through nTreg. (a) To analyse the number of CD4+CD25+ regulatory T cells in peripheral blood we quantified the CD4+CD25high cells indicated by the circle. The percentage of forkhead box P3+ (FoxP3+) cells within the CD4+CD25high population did not differ over the 24-h period or between the sleep and sleep deprivation condition; 91·5% ± 1% of the CD4+CD25high cells were positive for FoxP3 (data not shown). (b) CD4+CD25+ regulatory T cells were counted in peripheral blood from healthy men during sleep (closed circles) or sleep deprivation (open circles). (c) CD4+CD25− T cells and nTreg were isolated from peripheral blood of healthy young men with sleep (closed circles) and without nocturnal sleep (open circles). CD4+CD25− T cells were stimulated polyclonally either in the presence or absence of nTreg. The inhibition of CD4+CD25− T cell proliferation by nTreg was calculated (for detailed information see Material and methods). (d) Peripheral blood mononuclear cells (PBMC) and PBMC depleted of nTreg were stimulated polyclonally and the inhibition of CD4+ T cell proliferation through the presence of nTreg was quantified in cells isolated from healthy young men with sleep (closed circles) or sleep deprivation (open circles). Shaded area indicates bedtime. Mean values ± standard error of the mean (n = 7).