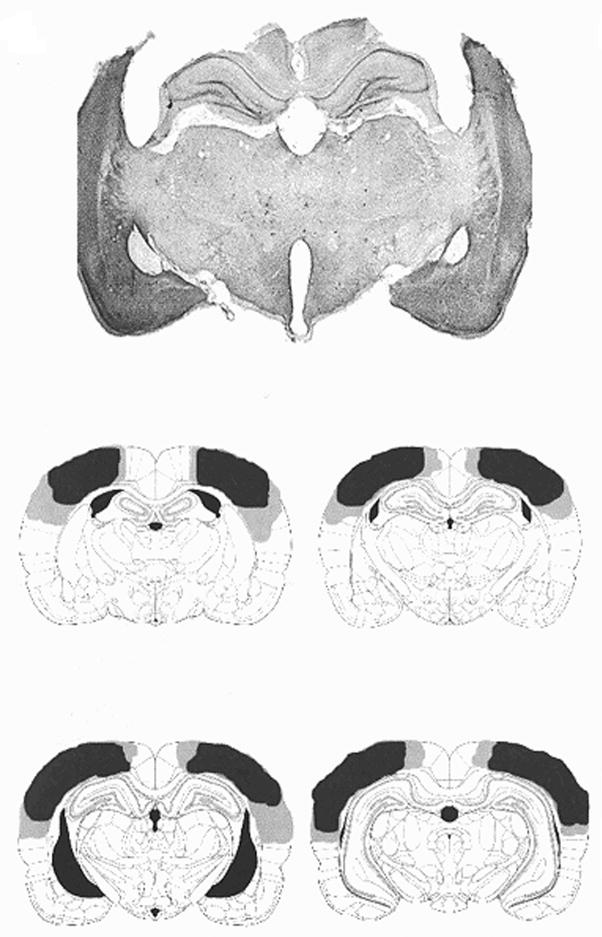
Figure 1.
A photomicrograph (multiplied by 12.5) of a representative section of a parietal cortex lesioned rat and schematic drawings of the largest (/light/ /gray)/ and the smallest (/dark gray/) damage within a group of PPC lesioned rats based on Paxinos and Watson’s (1997) atlas of the rat brain.

