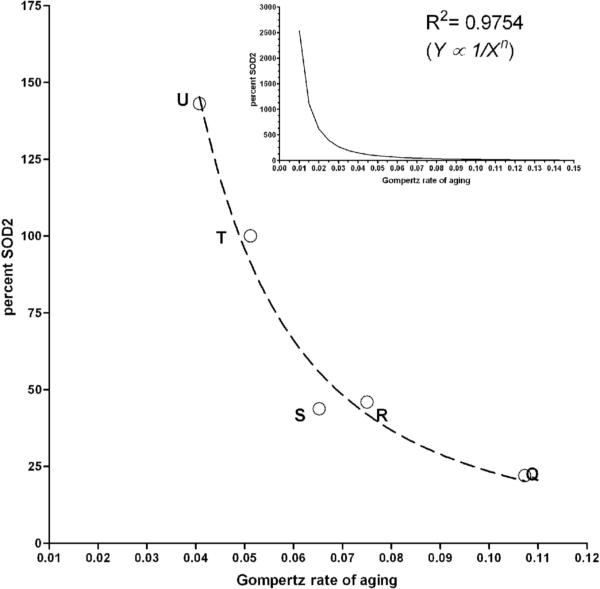
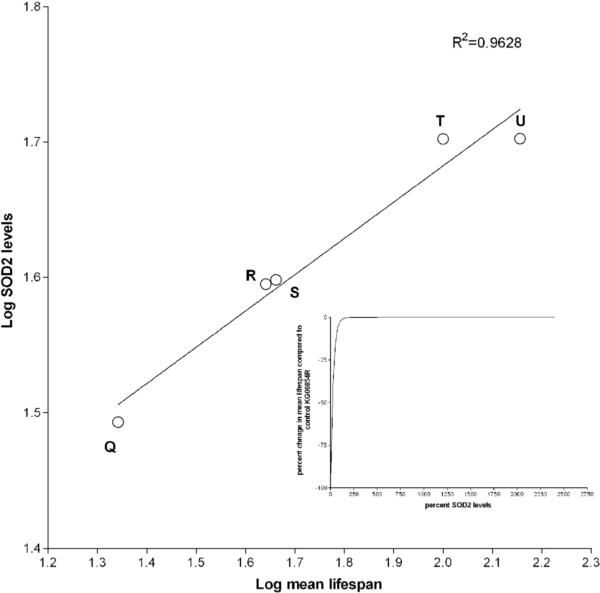
Figure 4.
Relationship between SOD2 expression and demographic parameters. Q= Sod2n283/wk, R= Sod2n283/+, S= Sod2wk/wk, T= KG06854R and U= Sod2+/+; P{Sod2+/+}. (A) A power law relationship was observed when the demographic rate of aging (parameter b from WinModest) was plotted versus percent SOD2 expressed. R2 = 0.9636. Inset shows projected rate of demographic aging as a function of percent SOD2 expression, indicating that a marginal decrease in the rate of demographic aging will occur with progressively increased levels of SOD2 expression. (B) Log mean lifespan versus Log SOD2 expression describes a straight line, indicating that the percent change in mean lifespan will eventually plateau after a certain level of SOD2 expression is achieved (inset).


