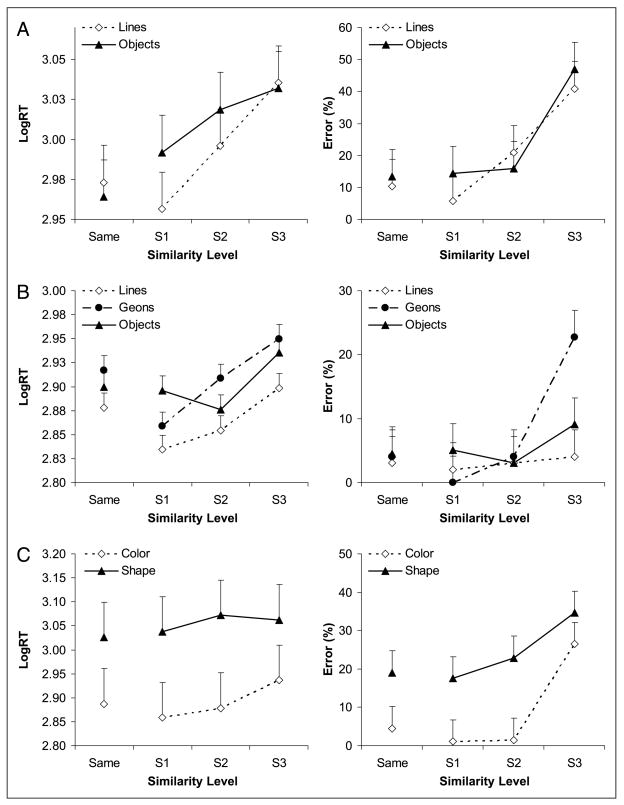
Figure 2.
(A–C) Behavioral performance for Experiments 1 through 3, respectively. In C, each color similarity level response is averaged across all shape similarity levels, and the converse for shape similarity. Error bars in this figure and Figures 3, 4, and 5 are within-subject confidence intervals for the similarity effect (Loftus & Masson, 1994).

