Figure 1.
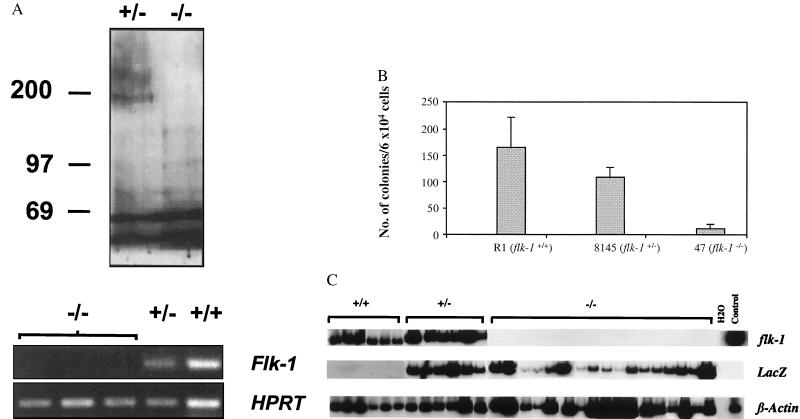
(A) flk-1−/− EBs do not express Flk-1 protein or flk-1 RNA. Lysates of EBs derived from flk-1−/− and +/− ES cells were analyzed by immunoprecipitation/immunoblotting by using polyclonal Flk-1 antiserum as described (19). The ≈200-kDa Flk-1-specific band is not seen in lysates from flk-1−/− EBs (Upper). A Flk-1-specific band was also not detected in lysates of [35S] methionine-labeled flk-1−/− EBs, while it was readily detected in flk-1+/−- derived samples (not shown). Total RNA was extracted from flk-1−/−, +/−, and +/+ EBs, cDNA was prepared, and PCR was performed with flk-1-specific probes as described (10, 11, and see Materials and Methods). Whereas flk-1-specific bands were detected in flk-1+/− and +/+ samples, they were not found in EBs derived from three independently derived flk-1−/− ES clones (Lower). Control PCRs performed with RNA in the absence of reverse transcription were negative in all cases. HPRT-specific RT-PCR serves as an RNA/cDNA loading control. −/−, flk-1−/−; +/−, flk-1+/−; +/+, flk-1+/+; numbers on left indicate position of molecular weight standards. (B) flk-1−/− ES cells give rise to greatly reduced numbers of blast colonies. The number of blast colonies from day 2.75 flk-1−/−, flk-1+/−, and +/+ EBs is shown. Similar results were obtained from three independent replatings. An average number from one such replating, obtained from triplicate plates, is shown. Error bars indicate standard deviations. Whereas the number of blast colonies from flk-1+/− EBs was somewhat lower than that from the flk-1+/+ EBs, the significance of the difference is not clear. R1, wild-type R1 ES cells; 8145, a flk-1+/− ES cell line; 47, a flk-1−/− ES cell line. (C) flk-1 and lacZ expression in flk-1+/+, +/−, and −/− blast colonies. Expression of flk-1, lacZ, and β-actin was determined by RT-PCR with 32P dCTP added to the PCR reaction. Bands were then visualized by autoradiography. −/−, flk-1−/−; +/−, flk-1+/−; H2O, PCR negative control. Day 6 EB cDNA, positive control.

