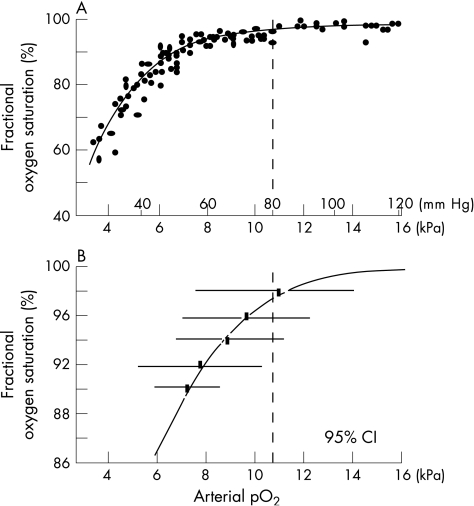
Figure 1 (A) The relationship between fractional oxygen saturation measured with a pulse oximeter and arterial partial pressure of oxygen (pO2) in mm Hg and kPa. (B) The bars show the range within which 95% of all measures of pO2 varied when the oximeter read 90%, 92%, 94%, 96% and 98% in the study reported by Brockway and Hay14. The dashed lines in A and B mark the transcutaenous pO2 above which there was an increased risk of retinopathy in the study reported by Flynn in 1992.11 Reproduced with permission from Neonatal Formulary.15

An official website of the United States government
Here's how you know
Official websites use .gov
A
.gov website belongs to an official
government organization in the United States.
Secure .gov websites use HTTPS
A lock (
) or https:// means you've safely
connected to the .gov website. Share sensitive
information only on official, secure websites.
