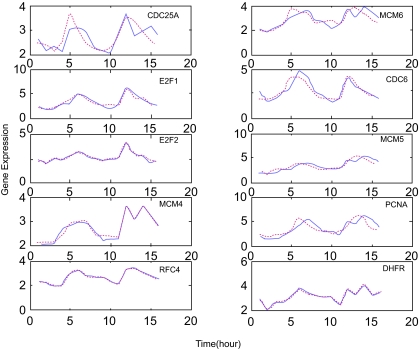
Figure 1. The second-order dynamic model fitting of E2F target genes.
The expression profile with the corresponding second-order dynamic model fitting for E2F target genes, CDC25A, MCM6, E2F1, CDC6, E2F2, MCM5, MCM4, PCNA, RFC4, and DHFR. The red dashed lines are the microarray data from Whitfield et al. 2002, and the blue solid lines are the estimated dynamic evolution of expression data by the proposed method. Obviously, the proposed second-order dynamic model could efficiently characterize the dynamic properties like damping and resonance of the gene regulatory network. The data have been transformed from the log scale in Whitfield et al. to linear scale.

