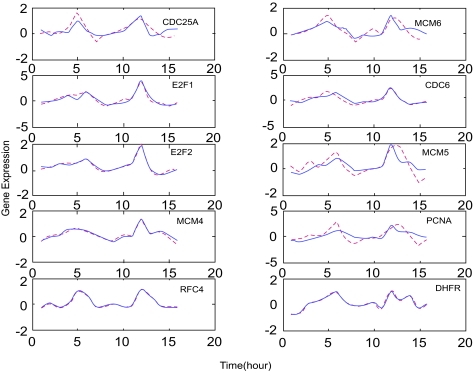
Figure 2. The extracted upstream regulatory functions from expression profiles (Whitfield et al. 2002) and their fitting by upstream regulatory genes.
The upstream transcriptional regulatory functions Ĝ(t) extracted from expression profiles of corresponding E2F target genes are denoted by the red dashed lines, and the blue solid lines are fitted by their upstream transcriptional regulatory functions in equation (6). These results show that the upstream TF regulatory model in equation (6) could match the regulatory function extracted from microarray data. In the figure, the gene expressions are expressed in linear scale.

