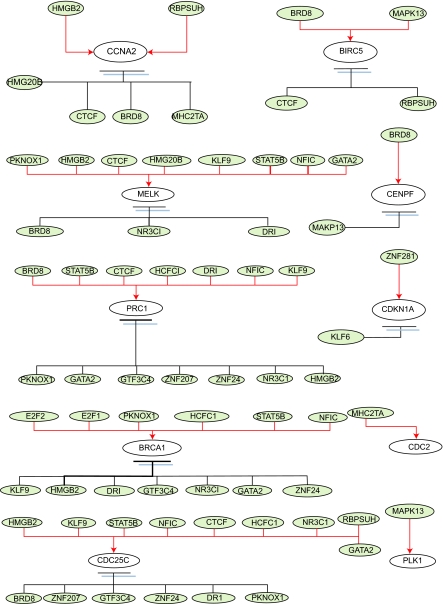
Figure 7. The regulatory pathways of target genes, which expressed in G2/M phase of human cell cycle, are based on the dynamic regulatory modeling.
The related genes are represented as gray ovals and the regulatory abilities of the related regulators implying different degree of influence are converted into red-colored lines as positive regulations (activations) and black-colored lines as negative regulations (inhibitions) for each target gene.

