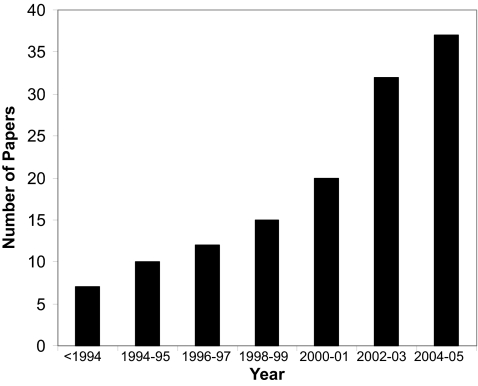
Figure 1.
A histogram showing the steady increase in published papers using machine learning methods to predict cancer risk, recurrence and outcome. The data were collected using a variety of keyword searches through PubMed, CiteSeer, Google Scholar, Science Citation Index and other online resources. Each bar represents the cumulative total of papers published over a two year period. The earliest papers appeared in the early 1990’s.

